
Analytics and a data-driven approach: improve your understanding and actions to make better strategic decisions!
All, or almost all interactions can be tracked, deciphered and analysed. However, in the digital ecosystem, I often notice that data gathered using the various analysis tools are poorly used because they are poorly interpreted.
And yet, a good understanding of this data will improve strategic and budget decisions within your business model! The user experience has become an essential factor in the current digital ecosystem. When navigating a website, customers not only want it to meet their expectations in terms of production selections, but above all in terms of experience!
This means that you need to put a lot of effort into analysis and interpretation, so collecting data on consumers' purchasing journeys on your website is of prime importance. And you also need to be able to decipher the behaviours of current and prospective customers and measure their user experience from a qualitative point of view!
What you need to analyse and how to analyse it
There are four key aspects to take into account:
- Acquisition (how did the user arrive at your website): in addition to the channels used, where exactly are your visitors coming from?
- Engagement (how does the user respond to your website): which pages are attracting visits?
- Conversion (what encouraged the user to make the purchase): which elements or factors (Attribution) come into play in the conversion funnel?
- Loyalty (what made the user return to your website): which products or content are keeping your visitors or customers coming back?
Google has created a user experience (UX) measurement model named 'HEART' (Happiness, Engagement, Adoption, Retention, Task success). These essential indicators provide a framework to analyse user experience.
Choosing which performance indicators to monitor and which tools to deploy on the website is essential in order to understand your customers' behaviours. However, collecting data will get you nowhere if you are unable to draw lessons from them and make the right decisions! There are several analysis methods in Digital Analytics. The four main types are behavioural analysis, attitudinal analysis, competition analysis and social analysis:
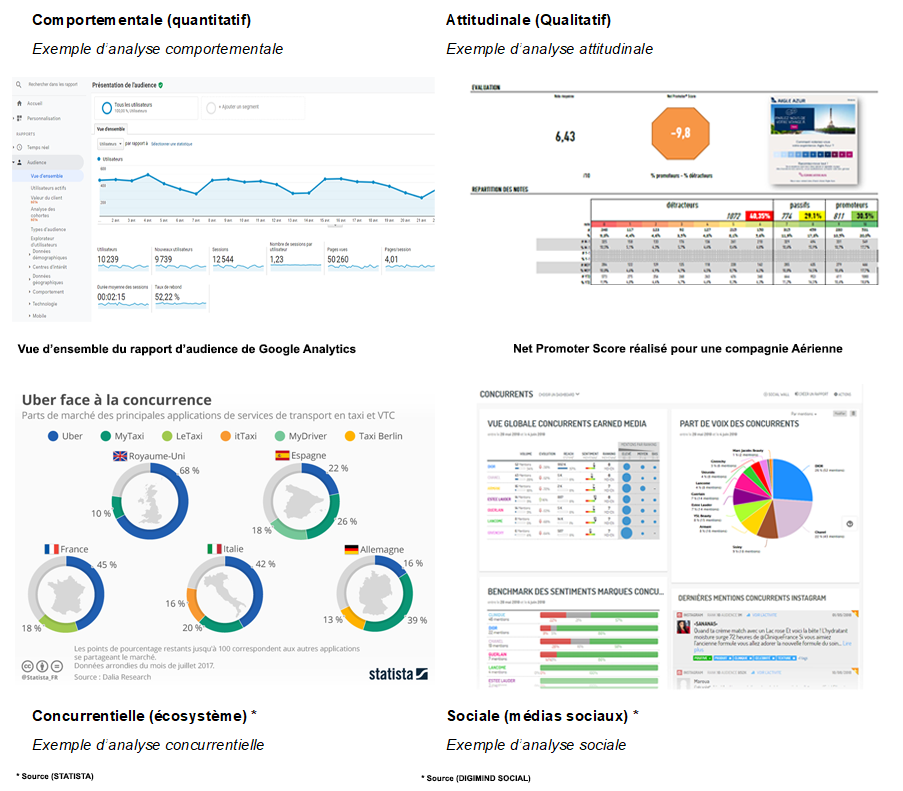
Above: Slide 1: Audience report from Google Analytics (in French) Slide 2: Net Promotor Score for an airline (in French) Slide 3: Competitive ecosystem (in French) Slide 4: Social media (in French)
Define KPIs that make sense and interpret them
There are many analytics tools out there: Adobe Analytics, AT Internet, IBM Digital Analytics… Google Analytics is the world's most popular, with an estimated market share of more than 85%. They are essential for any company that manages an online business, making it possible to better understand the behaviours of visitors and how they respond to your website. However, data alone is not enough!
Graphical representations (data visualization or dataviz) ensure that you intelligently interpret your data. They make it possible to analyse and visualise (through the representation of raw data) large amounts of data. There are several dataviz solutions available, such as Google Data Studio, Holistics, Qlik Sense, Microsoft Power BI and Salesforce Einstein.
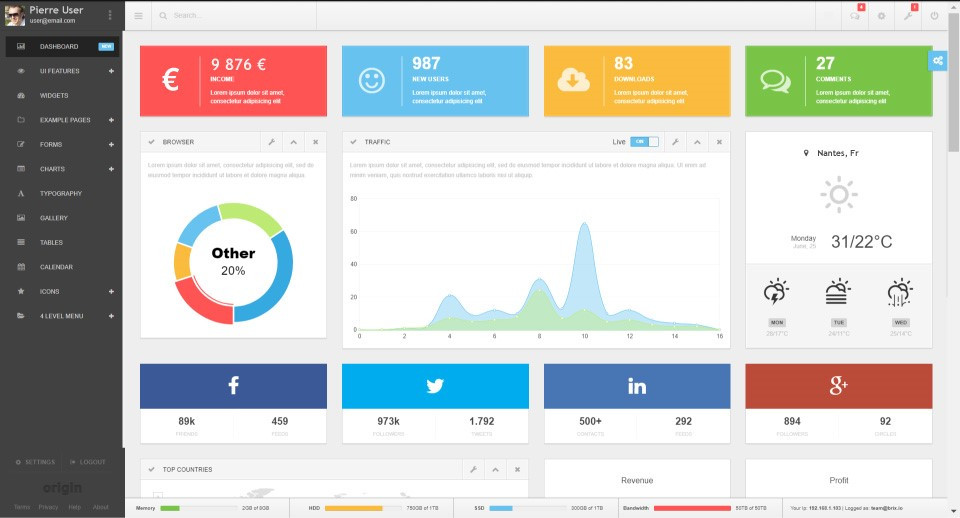
Example of a dataviz solution interface
We seek ways to improve our website when we perceive its limitations. It is up to you to define your actions according to the aspects you have analysed, whether it is purchasing frequency, transformation rate, bounce rate, product sharing or a newsletter subscription rate. Take the example of a form. We can question the design of a page or form when a user interrupts their navigation at a specific point.
Most websites have pages that are longer than the size of our screens and a single person will now use various types of screen (laptop, desktop, tablet, smartphone, etc.) Users therefore have to scroll down to view all of the content and information provided on a page or form.
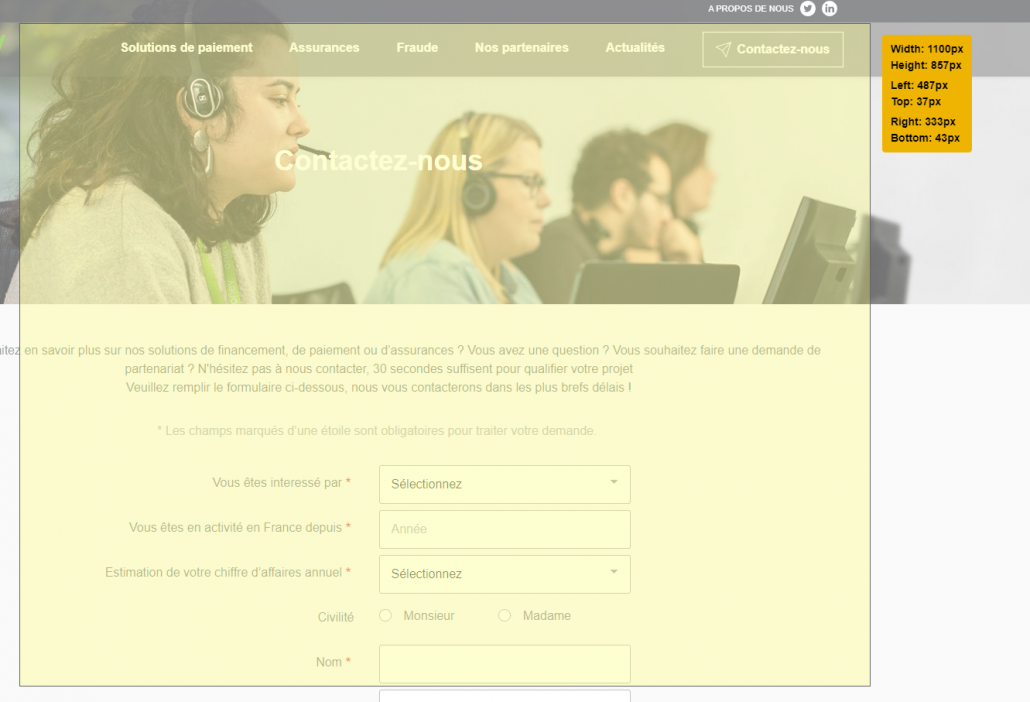
(Contact form – in French)
It is essential to see how far down the page visitors scroll, particularly if they are browsing a product page or form that contains important information.
Why use scroll tracking-based objectives?
Scroll depth
By creating an objective based on scroll tracking, you can monitor how many visitors view the full page. Scroll depth is useful if you are running a blog, for example, and you want visitors to read your articles (particularly if there is a CTA (call-to-action) button at the bottom of the article). However, it is impossible to create a funnel visualization.
You can always create several events (in Google Analytics) to track scrolling, with a specific depth for each event (for example 30%, 60% and 90% of the page). In this way, it is possible to create a funnel-shaped representation of visitor loss on each page. In the case of a form, you will be able to identify at which point, in terms of the fields or information requests, visitors leave the page.
(Re)define content and structure
In terms of SEO, scroll tracking can help you develop your content. It would be reasonable to assume that the content your users see last, before leaving a page, is the most interesting content on your website. By observing the most important events in Google Analytics, you will be able to easily identify the destination pages that most attract your visitors.
When a landing page generates traffic, one possible interpretation is that it is popular! However, it may not be effective in terms of engaging your visitors. By determining the scroll depth of your visitors on a given destination page, you can identify which information visitors want to see and adjust your content accordingly. You can also determine which content is the most attractive and works best in terms of general visitor engagement. You can then restructure or rewrite the content so that it contains more useful information.
For example, some blog articles can contain one or two paragraphs that are particularly interesting for your customers, but most of them leave your website after reading them. In this case, you can try changing the structure or content of the message itself, or write another one with more detailed information. Tracking scroll depth also lets you know if a destination page, or any other page including a call-to-action, contains anything that could be a distraction. If you notice that people leave a page having viewed only 50% of it, you can review this part of the page to identify potential issues.
Conversion or discovery?
In another example, suppose your website is recording a significant number of visits via the "social media" channel. However, these visits are brief and few pages are consulted. What can we deduce from this? Is the channel inappropriate for your target or are the visits not sufficiently qualified?
However, in this case, a rational explication could be that we are dealing with a "discovery", rather than a "conversion", channel: users are discovering your brand, your products and your online presence thanks to social networks, but they will not convert until later, during a second or third visit. You can verify this by consulting the Google Analytics reports in the following section: Conversions > Multi-Channel Funnels
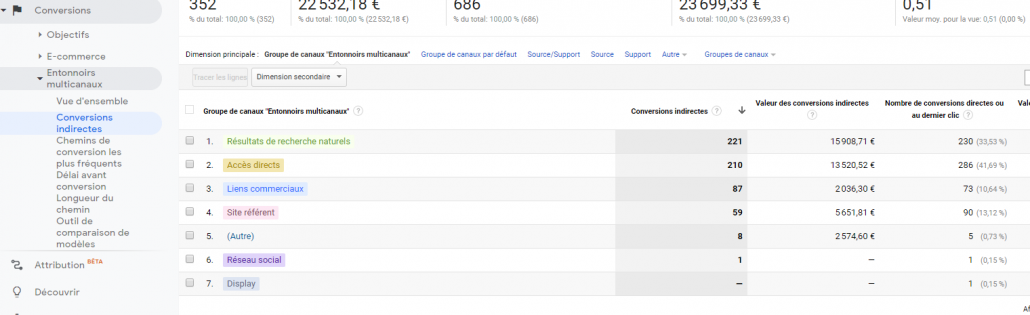
(Example in French below with 221 organic conversions)
Generally speaking, with the creation of an Attribution model project in Google Analytics, you can identify the relevance of different marketing channels and optimise media budgets according to the importance of each channel in the conversion process.
In this example, it is the creation of an Attribution project in Google Analytics. Bear in mind that there are two types of model: predefined and algorithmic.
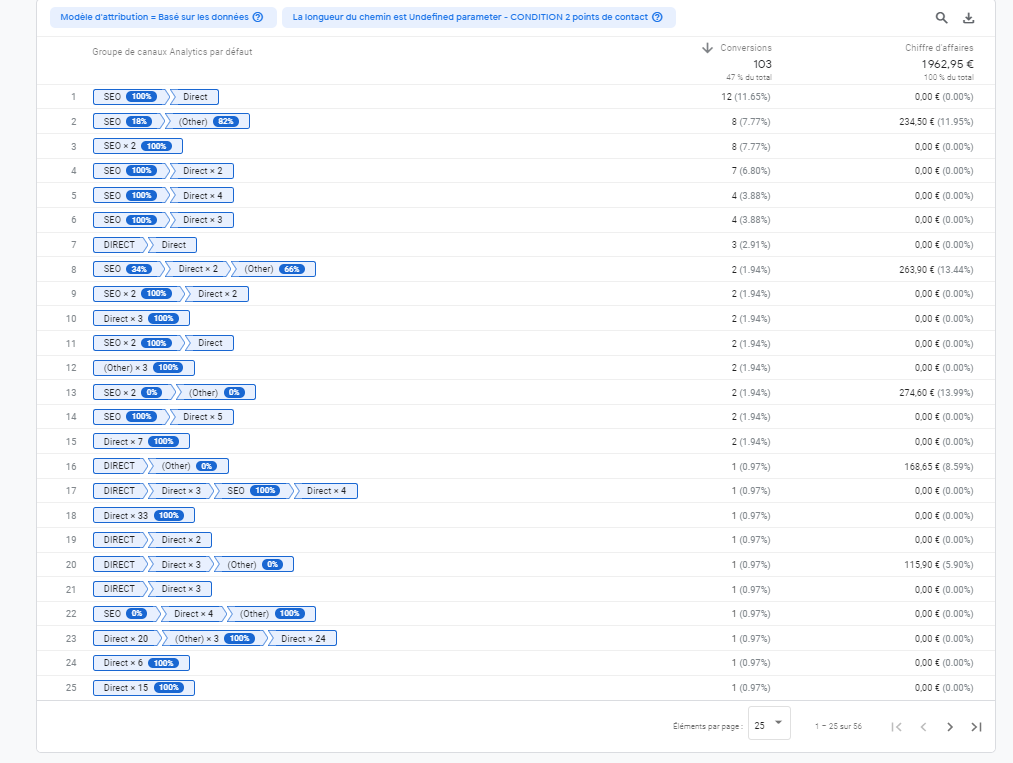
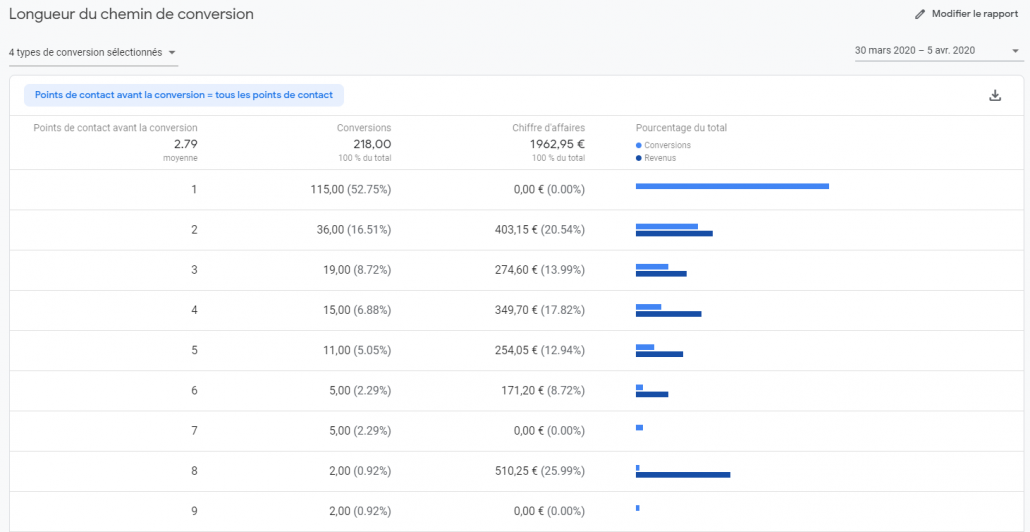
You can visualise the various stages (journeys) leading up to conversion. (Below: Touchpoints before conversion/Conversions/turnover – table in French)
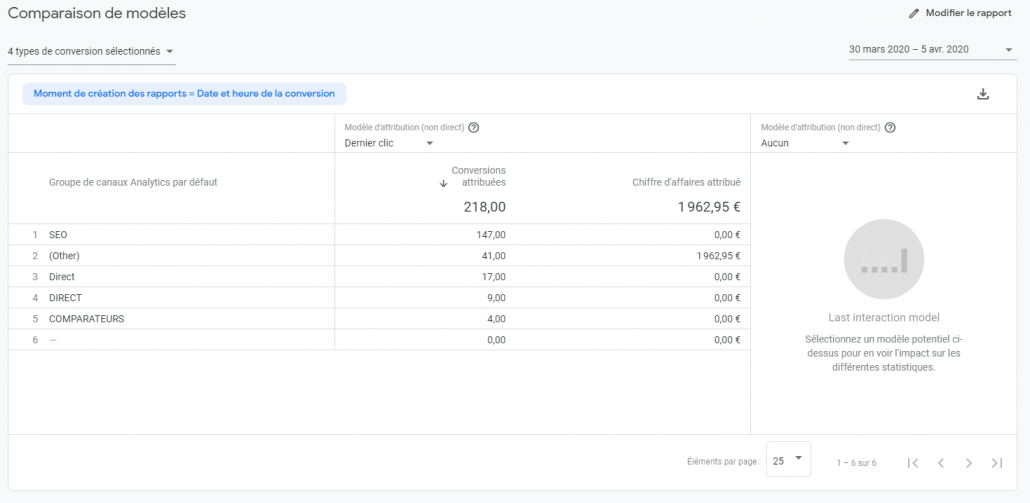
(Above: 4 types of conversion selected: SEO, Other, Direct, Comparative – table in French)
The list of analyses and their interpretations is long, and this article reflects only a tiny part of the possibilities open to advertisers when it comes to taking important decisions for their growth, both on and offline.
Today, we can gather and analyse data from various channels and devices: computers, tablets, smartphones, televisions, screens in stores, websites, interactive terminals, etc. We are able to analyse the impact of TV campaigns on in-store footfall (Holimetrix), and make footfall and audience predictions (Kameleoon, IBM Watson, etc.).
We can no longer content ourselves with reading dashboards without knowing what they really mean and the lessons to be drawn from them. When faced with countless sources of solutions and channels, it is essential to understand first before acting!
Definitions Data-Driven, or Data-Driven Marketing, is an approach that involves taking strategic decisions on the basis of data analysis and interpretation. The Data-Driven approach makes it possible to examine and organise data in order to better understand your consumers and customers. Analysis (Analytics) is the discovery, interpretation and communication of significant models within data.
Particularly useful in regions where there is a rich source of recorded information, analysis (Analytics) is based on the simultaneous application of statistics, computer programming and operational research in order to quantify performance.