
Dataviz, a key tool to tackle exploding data!
Data visualization has become essential for businesses to tackle the mass of data created and the issues involved in processing it. The main point of data visualization – or Dataviz – is to save time searching for and analyzing information. The aim is to considerably improve decision-making.
Making good decisions relies on the quality of the information available. Having raw data compiled in Excel spreadsheets does not place the decision-maker in an ideal position to make the right choices.
A real-life exemple concret de l'importance de la Dataviz
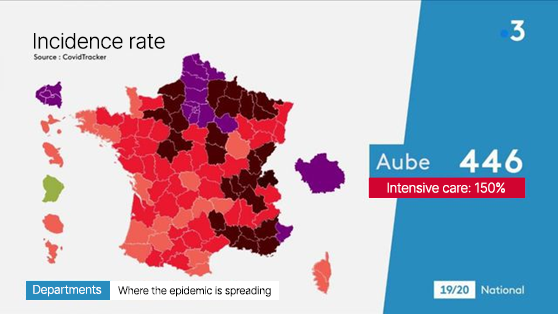
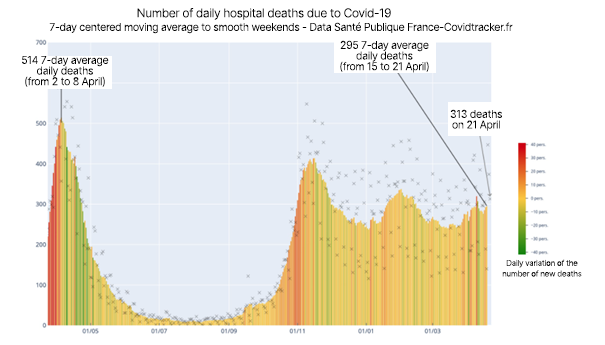
One type of data is currently being increasingly monitored worldwide: medical data. We have seen the extent to which the way we present data plays a crucial role in informing and helping healthcare professionals, the media, the general public, and even governments to monitor and understand the evolution of the pandemic.
In France, the data enthusiast and computer engineer, Guillaume Rozier, enables this kind of visualization using graphics accessible to all on CovidTracker, the online platform he developed. At a glance, we clearly visualize the up-to-date epidemic situation. Medical data visualization needs will probably still be needed for several more years.
Dataviz tools and solutions provide faster access to data and extends this access to as many users as possible, including the general public. They improve understanding of data and trends to identify threats and detect opportunities. For businesses, the question of Dataviz is a major issue.
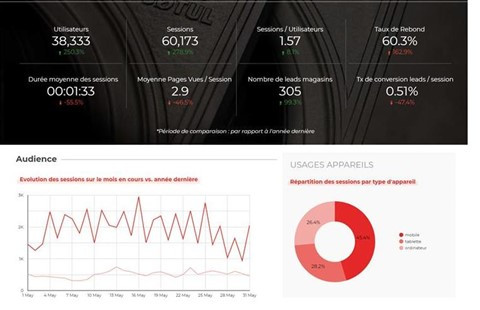
From a business development point of view, let’s take the example of CRM data visualization. One of the key points of a CRM tool is to detect fresh opportunities. Visualizations supplement CRM by providing more visual data, which is easier for decision-makers to understand. This means marketing and sales teams can make more considered decisions on their different actions, such as e-mailing campaigns to boost sales.
Open-source vs paid tools
Several open-source tools have sprung up over the last few years. But what is their position on the data market?
Faced with global giants like Tableau, Qlik and PowerBI, open-source tools are increasingly used. Some are more comprehensive than others. Examples include Grafana, Kibana and Hight Charts. Hight Charts has a library of graphics that can be easily integrated into websites. The choice of these tools is mainly based on economic reasons and willingness to contribute to a community-based project.
In some cases, switching to open-source tools reduces the number of features available, or even means there is no editor support, which is only available for the enterprise version. But the financial gain is non-negligible. Open-source tools offer frequent updates including new features and bug fixes.
The importance of UX to produce understandable graphics
Whatever option you pick, Dataviz tools let you produce dashboards meeting user needs. So user experience is fundamental in producing these dashboards. UX lets you provide an instinctive reading-based display meeting key user needs, as well as including secondary reading levels to examine KPIs in detail.
A closer look at ELK (or Elastic Suite)
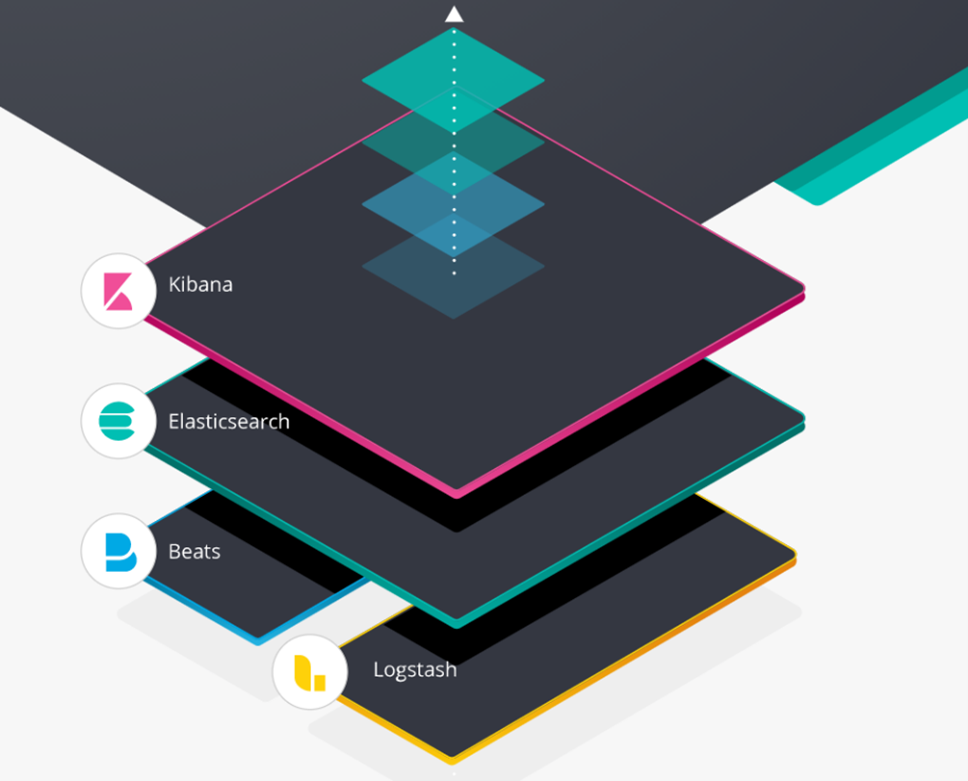
Unlike other open-source solutions that include limited features or focus only on the visualization component, ELK or Elastic Suite is a comprehensive solution. It combines data recovery from several data sources using its functional modules:
- Logstash (ETL): a tool to collect, analyze and process data;
- Beats (log listening): a set of agents that transfer log data to Logstash and Elasticsearch;
- ElasticSearch: renowned for storing and processing quite high-volume data;
- Kibana: enables data visualization using a wide range of graphical depictions.
This is why some businesses are choosing this solution that includes all the tools they need to process data. And that lets them save time, whether during setup or maintenance!
One of the specific characteristics of this tool is its ability to manage a huge volume of data. ELK was selected by one of the businesses I supported, as it needed to monitor data recovered via APIs every minute, and be alerted of any data recovery errors. This business provides its count data in near-real time, based on different grids and different granularities. It is provided via the API intermediary, published on the business’s client data portal. The aim of the Dataviz project is to ensure services run smoothly.
As we saw, ELK is one of the tools available on the Dataviz market. The rise in the number of solutions is a sign of the critical importance of data visualization, which is becoming increasingly clear. The right choice of solution for your business comes down to several criteria: cost, the use you’re going to make of it, and the flexibility you need.
