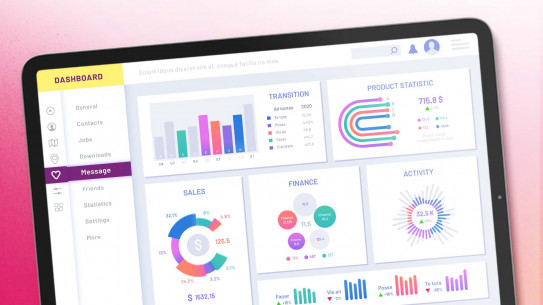
Dashboards & Data visualisation
Creating a digital visualization of your goals and data? The first step is to make sure it's comprehensible and accessible. At SQLI, we provide data visualization services. No more wasting time because of statistics!
Track the effectiveness of your marketing initiatives with the help of our performance team and make easy adjustments when needed. Do you want to know where you should focus your efforts? We're happy to assist you!
Why data visualization and what is a dashboard?
To gain insights into your organization on operational and strategic KPIs, you can use data visualization to portray your data using graphs and tables. A (web analytics) dashboard gathers and visualizes the most relevant data to provide an overview and track the performance of certain indicators over time. Google Data Studio is a fantastic example. A properly designed dashboard can help you realize what is going well in your organization and what needs more attention.

Marketing vs Business data
A dashboard is built on your operational and/or strategic data, directly on your operational system, your data warehouse or a combination of both. The data of your business can be SAP: ECC, S4HANA, C4C, Hybris, Commerce... If you have marketing data you will most likely work with Google Data Studio, Odoo, Microsoft Dynamics, Dataverse, Twitter, Facebook, Instagram...
Marketing data is just one dashboard for web, e-commerce, social traffic and ROIs. Because we’re talking about big data, data visualization/dashboarding is used in several domains: A dashboard is created using operational and/or strategic data from your operational system, data warehouse, or a mix of both. Your company's data could be stored in SAP: ECC, S4HANA, C4C, Hybris, Commerce...
Data is the new oil.
The information that matters
Would you like a simplified version of your analytics, so you can spend less time organizing it and more time looking at it? You've arrived at the right agency! We can help you with a data visualization for numerous domains like finance, purchasing, supply chain, delivery, HR, CRM, e-Commerce, socials...