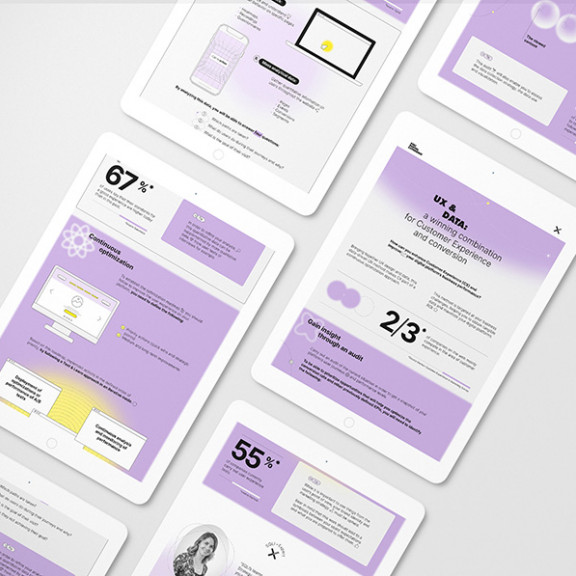
[Infographic] UX & Data : a winning mix for conversion and Customer Experience

After a terrible experience, 88 percent of users are less likely to return to a website.

About the infographic

Customer experience (CX) is a continuous activity that aims to give the best possible user experience while also increasing loyalty.

We offer the Data-driven UX optimisation strategy in this infographic, which combines the UX approach with data. This strategy produces measurable data that can be used to improve the commercial performance of your digital platforms and increase ROI.
Conversion, turnover, average basket, lead generation, customer satisfaction... are all areas where data-driven UX can help.

This is a two-step process that begins with a review of your platform's performance and user journeys and ends with the implementation of an optimization strategy.


This infographic provides you with:

  • The steps and objectives of the audit of the existing,
  • The data to be collected to carry out this audit,
  • The optimization roadmap in a Test & Learn approach.


*Source: Toptal

Download

The information completed in the form is intended for SQLI. It is collected and used to send you the communications you have requested. If you no longer wish to receive our communications, you can unsubscribe by using the link located in the footer of our emails.